Understanding the CAPC Forecast Maps
Each spring, CAPC publishes annual forecasts maps for Lyme disease, ehrlichiosis, anaplasmosis and heartworm disease for the contiguous United States (US), as well as a Lyme disease forecast for southern Canada. These maps predict the proportion of dogs tested in veterinary clinics who will receive a positive test result for antigen (D. immitis) or antibody (Borrelia burgdorferi, Ehrlichia spp., and Anaplasma spp.) detection. The forecast maps are derived from routine testing data collected from clinics across the US and Canada and then aggregated by year and county (in the US) or forward sortation area or FSA (in Canada). There are over 61 million test results for each the three tick-borne agents and over 121,000,000 test results for the heartworm parasite. The maps also leverage several other data sources, including annual temperature, relative humidity and precipitation data collected from the PRISM database maintained by Oregon University1 (US), or the ClimateNA model2 (Canada), elevation and other ecological data derived from the National Land Cover Database3 (US) and North American Land Change Monitoring System4 (Canada), and socio-demographic data such as median household income and population density obtained from the US Census Bureau5 and the Canadian Census of Population6. The heartworm forecast also leverages data on the presence or absence of 5 Aedes, 2 Anopheles and 1 Culex mosquito species7.
The maps are produced using a Bayesian spatio-temporal regression model. This advanced statistical model has been the subject of five peer reviewed publications8–12. The model ‘borrows’ information across space and time by exploiting spatio-temporal patterns present in the data. This enables the model to make predictions even where data is sparse or non-existent. The county/FSA level predictions produced by the regression model are smoothed to produce the final maps.
The predictive accuracy of the maps can be assessed with a weighted correlation. Similar to a regular statistical correlation, a weighted correlation ranges between -1 and 1 and indicates the strength of the linear relationship between two quantities. The closer a weighted correlation is to 1, the better the forecasts predict the observed data. However, we expect the forecasts to perform better in areas which report a large number of tests and thus we wish to penalize errors in these areas more strongly. The weighted correlation scales the difference between the forecasted and observed values by the number of tests reported in a county or FSA, thereby assigning a stronger penalty to errors in areas reporting a large number of tests. The table below reports the weighted correlation between the forecast and the observed data for each disease from 2016 to 2022. To produce these weighted correlations, the forecast model was fit using data up to but not including the year in question. The forecasted probability of testing positive was then compared to the proportion of positive tests that were observed that year. As evidenced in the table, the forecasts are highly accurate, though the heartworm forecast performs somewhat more poorly than the other three (see the limitations section for more information).
Disease | 2016 | 2017 | 2018 | 2019 | 2020 | 2021 | 2022 |
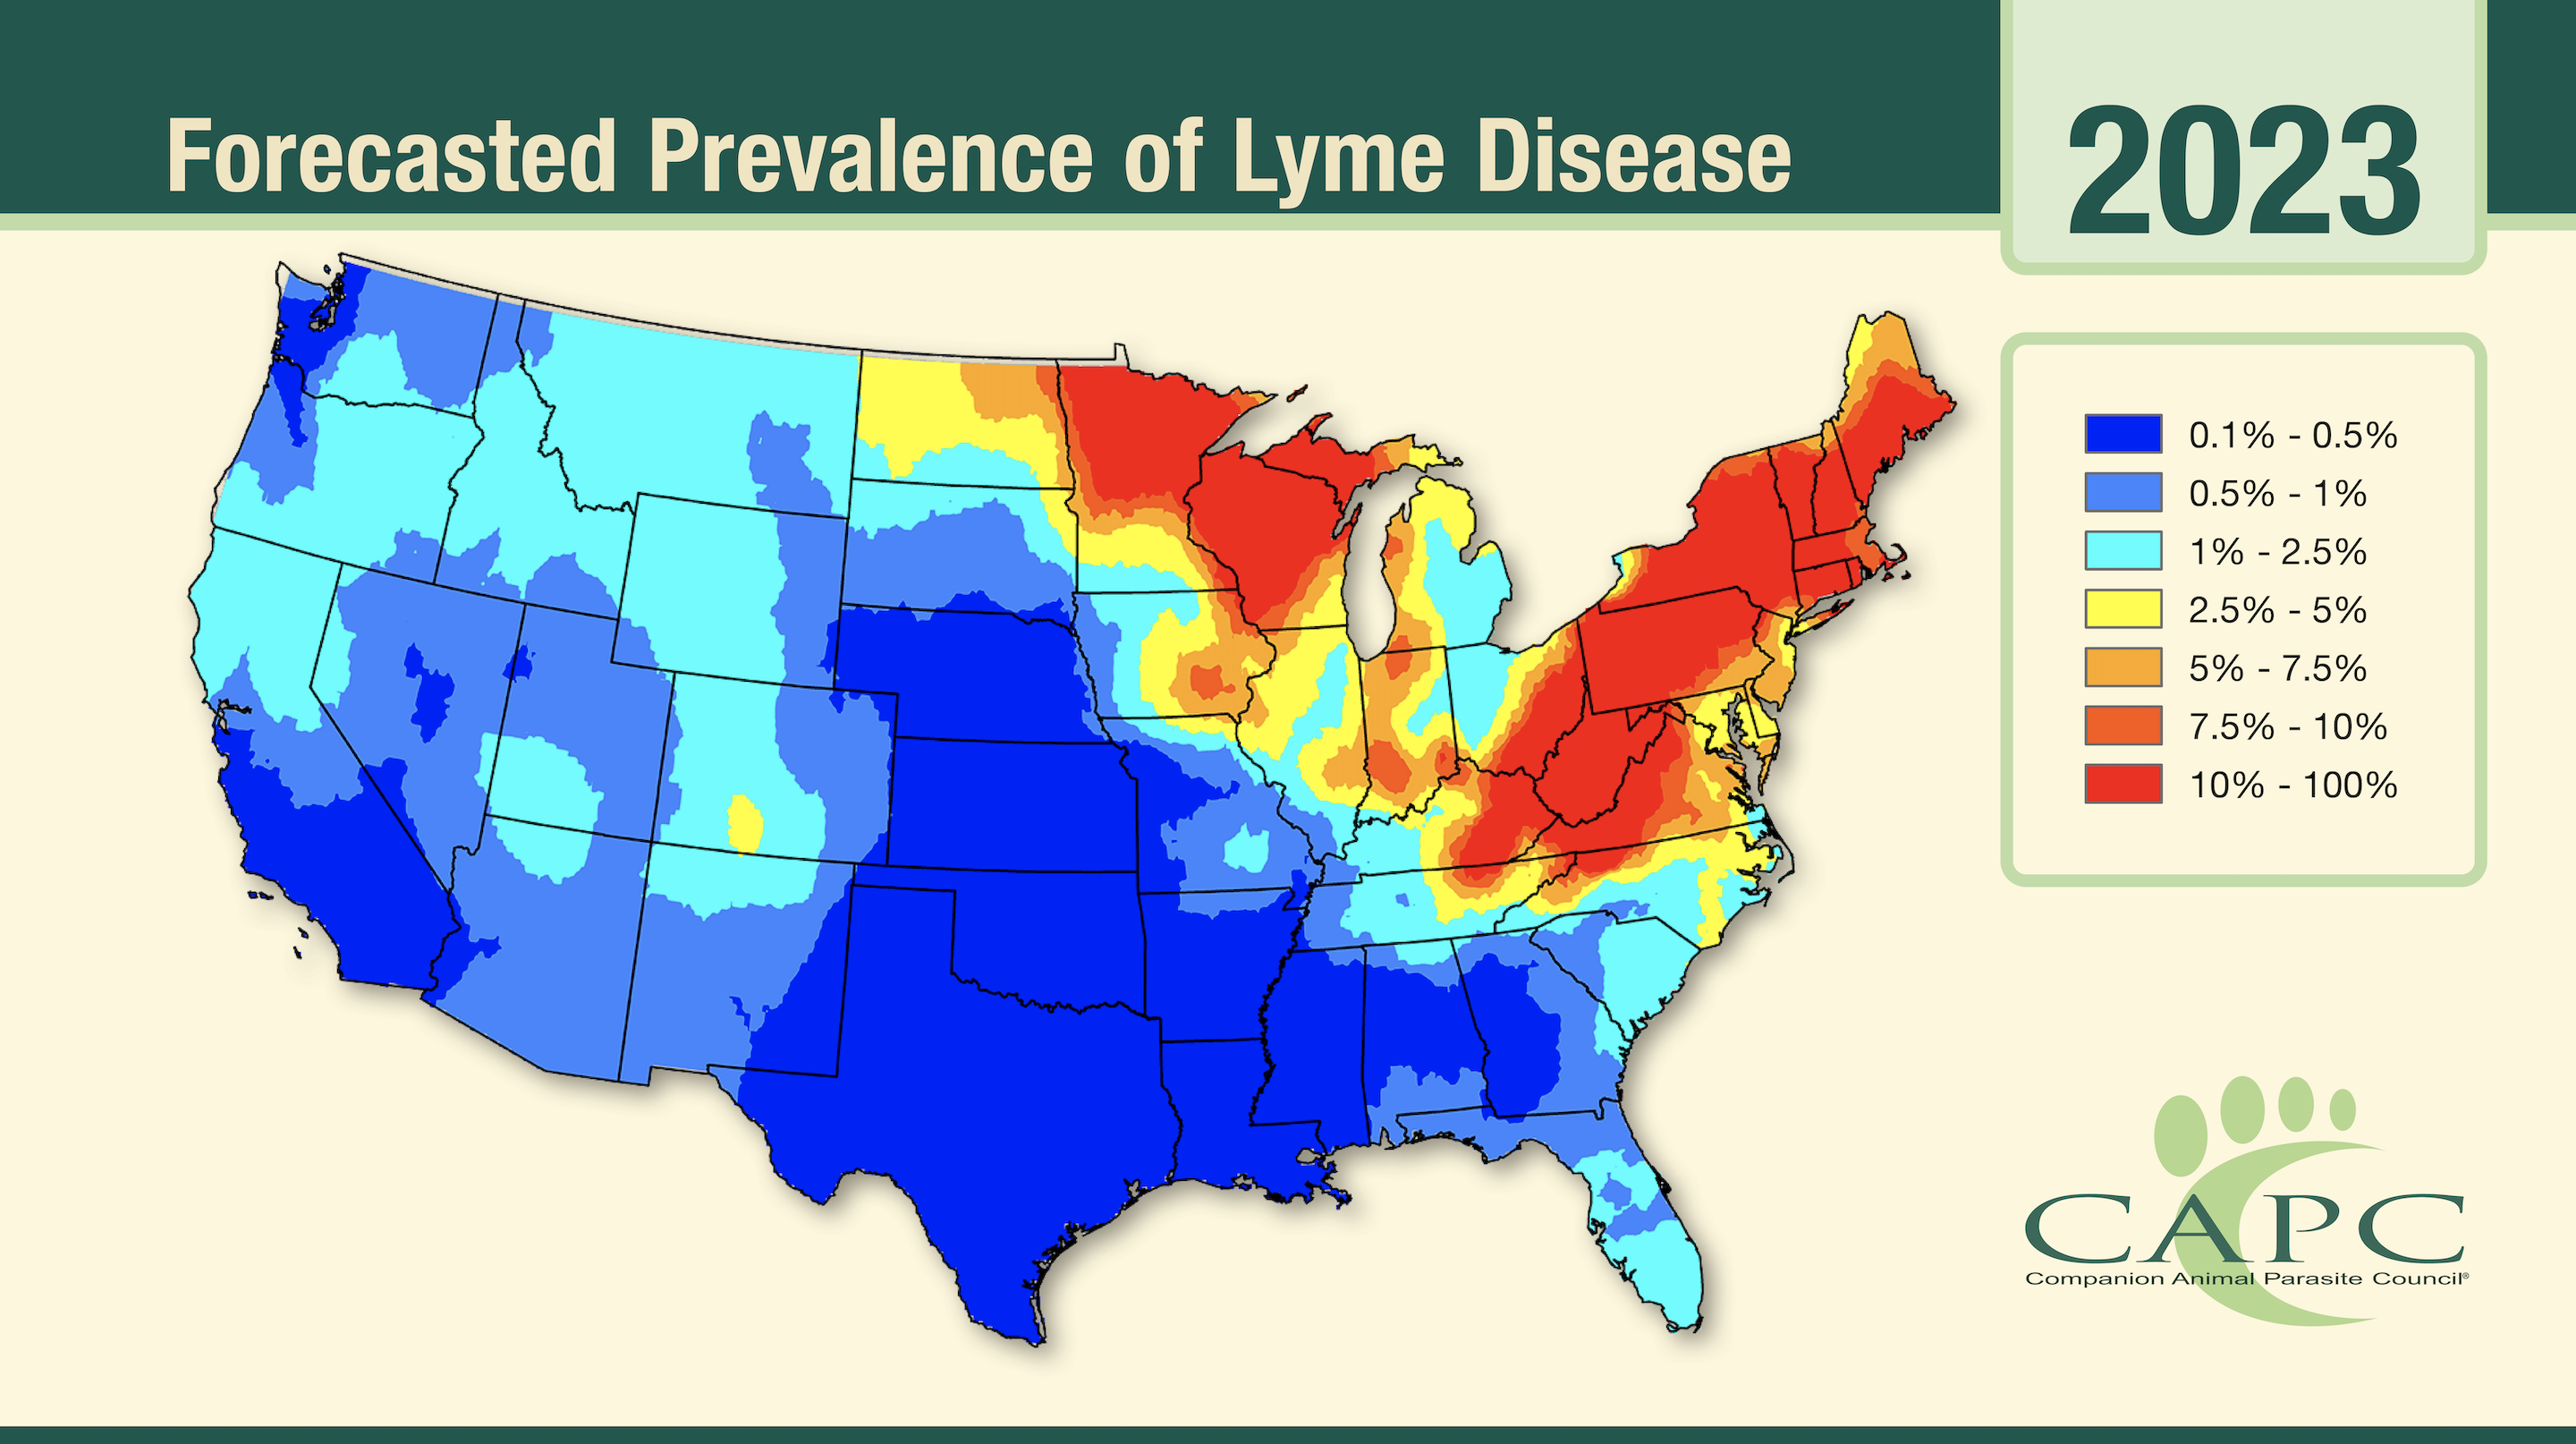
Lyme disease (US) | 0.99 | 0.98 | 0.99 | 0.99 | 0.99 | 0.94 | 0.99 |
Anaplasmosis | 0.99 | 0.99 | 0.99 | 0.99 | 0.99 | 0.99 | 0.99 |
Ehrlichiosis | 0.98 | 0.98 | 0.98 | 0.98 | 0.99 | 0.99 | 0.98 |
Heartworm | 0.86 | 0.85 | 0.78 | 0.94 | 0.94 | 0.92 | 0.90 |
While the forecast maps are a powerful tool for educating veterinarians and pet owners about the risk of exposure and potentially disease in their geographic area, the maps are nonetheless subject to some limitations which must be considered when interpreting the maps. Diagnostic tests are imperfect and can return both false positive and false negative results. As the forecast maps cannot distinguish between true positives and false positives, the maps do not display the predicted prevalence of infection, but the probability that a dog will receive a positive test result. The probability of testing positive can be higher or lower than the true prevalence of infection, depending on the accuracy of the tests used and the underlying prevalence itself. However, provided the test is reasonably accurate and the prevalence of infection is neither extremely high nor extremely low, the positive rate is usually close to the true prevalence of infection.
The forecast maps are intended primarily as an educational tool for veterinarians and pet owners. The maps predict the probability that an ‘average’ dog will test positive or, alternately, the proportion of dogs who will test positive in a local clinic. Veterinarians can use the maps to educate their clients about the risk a particular vector poses to local dogs. The maps are a convenient tool for starting a conversation about the risk parasites pose to pets and the need for preventative measures. Veterinarians and clients can make more informed decisions about diagnostic testing using the maps, as the maps provide insight into how likely a dog is to test positive. The maps can also be used to educate clients about the need for preventative measures to keep their pets healthy.
The forecast maps inform veterinarians about spatial patterns in exposure and disease risk. Parasitic diseases often display regional patterns, with certain infections being more common in some areas than in others. For example, Lyme disease is more common in the Northeast and Midwest regions of the United States than in other parts of the country. If a dog has traveled, veterinarians can use the maps to determine if dog has visited a high-risk region. Such information is valuable for guiding decision making about diagnostic testing. Parasitic disease risk often changes over time. Clinics located on the edge of endemic regions need to be particularly aware of shifting geographical patterns. The maps can also be used to alert veterinarians in these key regions of potential changes in risk.
The proper interpretation of the forecasting maps depends on the diagnostic test used. The data driving the heartworm forecast map comes from antigen tests, while the data behind the other three maps comes from antibody tests. The presence of antigens typically implies active infection, so the heartworm forecast map predicts the probability that a dog will test positive for active heartworm infection. Antibodies can indicate current or past infection and cannot predict if disease will develop. The Lyme disease, ehrlichiosis and anaplasmosis forecast maps predict the probability that a dog will test positive for current or past infection. These three maps do not provide an estimate of the prevalence of active infection alone or the amount of disease in the population.
The forecast maps are subject to a number of limitations, many of which arise from the data used to create the maps. This data is displayed in CAPC’s Parasite Prevalence Maps and an in-depth discussion of the data displayed in these maps can be found here (add link to Understanding the Maps article). The forecast maps do not account for the history of a dog prior to testing or the reason for testing. Dogs who travel with their owners may contract infection while traveling and then test positive upon returning home. The location of a positive test does not always correspond to the location infection was acquired. Unexpected increases in positive tests in areas where risk is typically low may be due to travel. This is especially true in high travel volume areas. Additionally, the forecast maps display the predicted proportion of dogs who test positive, which can also be interpreted as the chance that an ‘average’ dog will test positive. The chance that any particular dog will test positive may be higher or lower than average due to factors specific to that dog. For example, a symptomatic dog may be more likely to test positive than an asymptomatic dog, while a dog on preventative medication may be less likely to test positive than an unprotected dog. While the maps provided a baseline estimate of the chances of testing positive, veterinarians should consider a dog’s individual characteristics when making decisions about testing.
The forecast maps primarily apply to animals under veterinary care. As the testing data underlying the maps is derived from tests performed in veterinary clinics and shelters, the estimated probability of testing positive applies only to this population of dogs. Domestic dogs without a veterinarian or feral dogs likely have a higher burden of disease than dogs receiving care. As a result, the probability that a dog not receiving routine veterinary care will test positive is likely higher than what is indicated by the forecast maps.
The Bayesian spatio-temporal regression model used to make the maps ‘borrows’ information across space and time by exploiting spatio-temporal patterns present in the data. While this borrowing enables the model to make predictions even where data is sparse or non-existent, the forecasts tend to be somewhat more reliable in areas which report more data. Furthermore, because the model borrows information across space, it tends to make more robust predictions in areas surrounded by a lot of data and more variable predictions on boundaries and in isolated geographic areas (e.g. islands and peninsulas). In the United States, the testing data is sparsest in the Great Plains and Rocky Mountain states. As these areas are in the interior of the country surrounded by regions reporting lots of data, the spatial borrowing mechanism works well. In Canada, most of the data is reported along the southern border, where the majority of the Canadian population lives. Data becomes increasingly sparse as one moves north. As the regions with sparse data in Canada are not surrounded by data rich regions, the spatial borrowing of information is less reliable for Northern Canada than it is for the US. As a result, the CAPC Lyme Disease forecast for Canada only covers areas near the US border.
References
1. Prism Climate Group: Northwest Alliance for Computational Science and Engineering, "Data Explorer: Download Time Series in Bulk," (2019).
2. Wang, T., Hamann, A., Spittlehouse, D. & Carroll, C., "Locally Downscaled and Spatially Customizable Climate Data for Historical and Future Periods for North America," PLoS One 11, e0156720 (2016). at <;
3. Multi-Resolution Land Characteristics Consortium, "Data," (2020). at <https://www.mrlc.gov/data?f%5B... cover>
4. Commission for Environmental Cooperation, "North Amerian Land Change Monitoring System," (2023). at <;
5. United States Census Bureau, "County Intercensal Datasets," (2018).
6. Statistics Canada, "Census of Population," (2023). at <;
9. Liu, Y., Watson, S. C., Gettings, J. R., Lund, R. B., Nordone, S. K., Yabsley, M. J. & McMahan, C. S., "A Bayesian spatio-temporal model for forecasting Anaplasma species seroprevalence in domestic dogs within the contiguous United States," PLoS One 12, e0182028 (2017). at <;
12. Watson, S. C., Liu, Y., Lund, R. B., Gettings, J. R., Nordone, S. K., McMahan, C. S. & Yabsley, M. J., "A Bayesian spatio-temporal model for forecasting the prevalence of antibodies to Borrelia burgdorferi, causative agent of Lyme disease, in domestic dogs within the contiguous United States," PLoS One 12, e0174428 (2017). at <;