Articles from the Experts
Sort Articles by:

Avoiding Common Pitfalls in Microscopic Fecal Examinations
by Dr. Byron Blagburn MS, PhDA “fecal” may seem like one of the more humble tasks performed in a veterinary hospital. That does not diminish the importance of this examination, which can provide valuable information on the health status of veterinary patients. Parasite diagnosis and monitoring are vital to pet health and the health of pet owners, given the zoonotic potential of many parasites...
Read More
Microscopic Fecal Exam Procedures
by Dr. Byron Blagburn MS, PhDFecal examination procedures likely to be accepted and implemented in most veterinary practices include centrifugal flotation, sedimentation, and direct examination (direct smear). Only flotation and sedimentation are concentration procedures. Direct smears have poor sensitivity because of the small amount of feces examined but may be useful for demonstrating motile organisms. CAPC recommends that feces be routinely screened by a centrifugal flotation method, which is consistently more sensitive than simple flotation. Accuracy of centrifugal flotation techniques depends on procedural details and specimen attributes...
Read More
The Case for Year-Round Flea and Tick Control
by Dr. Mike DrydenFleas and ticks are more than mere nuisances. They cause distress in dogs and cats and, more important, they cause disease. On-again, off-again preventive programs are not the optimal way to safeguard the health of pets and their families...
Read More
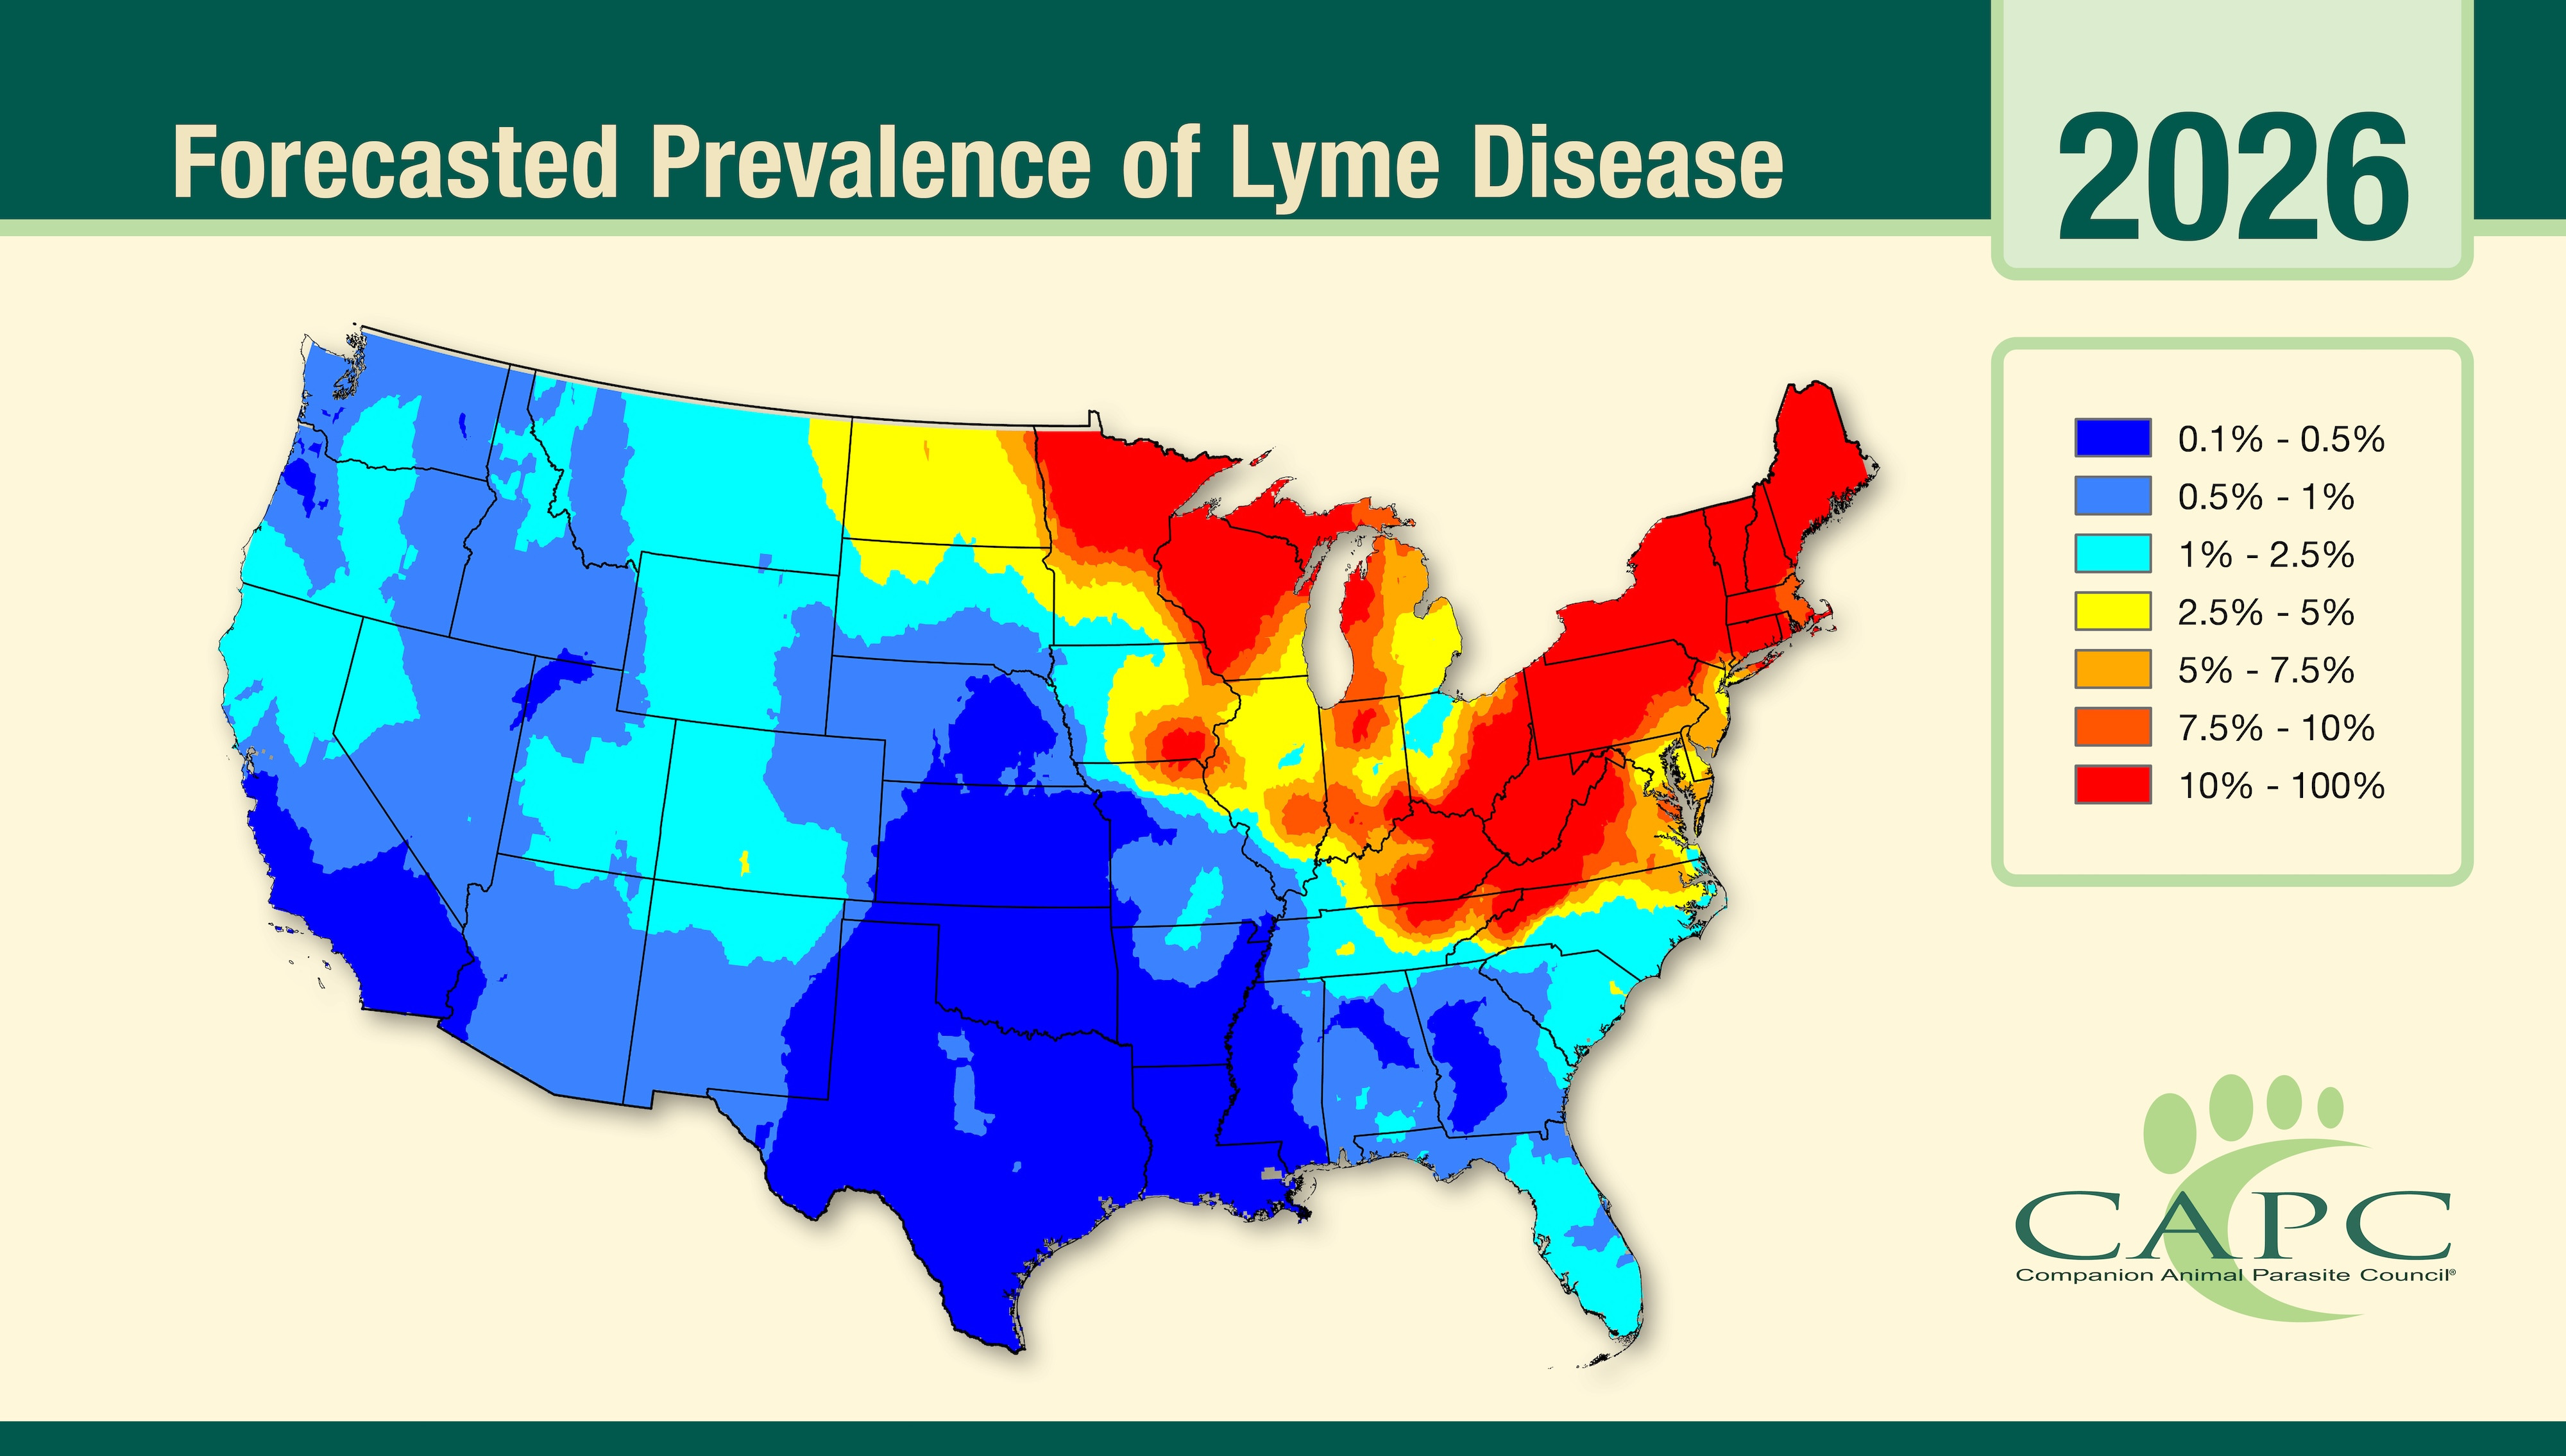
Understanding the CAPC Forecast Maps
by Stella Coker Watson Self, PhDEach spring, CAPC publishes annual forecasts maps for Lyme disease, ehrlichiosis, anaplasmosis and heartworm disease for the contiguous United States (US), as well as a Lyme disease forecast for southern Canada. These maps predict the proportion of dogs tested in veterinary clinics who will receive a positive test result for antigen (D. immitis) or antibody (Borrelia burgdorferi, Ehrlichia spp., and Anaplasma spp.) detection. The forecast maps are derived from routine testing data collected from clinics across the US and Canada and then aggregated by year and county (in the US) or forward sortation area or FSA (in Canada). There are over 61 million test results for each the three tick-borne agents and over 121,000,000 test results for the heartworm parasite. The maps also leverage several other data sources, including annual temperature, relative humidity and precipitation data collected from the PRISM database maintained by Oregon University1 (US), or the ClimateNA model2 (Canada), elevation and other ecological data derived from the National Land Cover Database3 (US) and North American Land Change Monitoring System4 (Canada), and socio-demographic data such as median household income and population density obtained from the US Census Bureau5 and the Canadian Census of Population6. The heartworm forecast also leverages data on the presence or absence of 5 Aedes, 2 Anopheles and 1 Culex mosquito species7...
Read More
Understanding the Maps: Key Factors that Influence the Results
by Heather Walden MS, PhDThe CAPC Parasite Prevalence Maps are designed to show the proportion of pets tested which test positive for a given infection using available assays. This data is very useful to veterinarians and others trying to better understand the prevalence of parasites in a given practice area, but as with any survey, the results can be influenced by a number of factors, including the number of pets tested, the history of the pets prior to testing, the reason the pets were tested, and the assays used. Understanding each of these factors is critical to accurately interpreting the geographic distribution of these important disease agents...
Read More
The Case for Year-Round Flea and Tick Control
by Dr. Mike DrydenFleas and ticks are more than mere nuisances. They cause distress in dogs and cats and, more important, they cause disease. On-again, off-again preventive programs are not the optimal way to safeguard the health of pets and their families...
Read MoreUnderstanding the CAPC Forecast Maps
by Stella Coker Watson Self, PhDEach spring, CAPC publishes annual forecasts maps for Lyme disease, ehrlichiosis, anaplasmosis and heartworm disease for the contiguous United States (US), as well as a Lyme disease forecast for southern Canada. These maps predict the proportion of dogs tested in veterinary clinics who will receive a positive test result for antigen (D. immitis) or antibody (Borrelia burgdorferi, Ehrlichia spp., and Anaplasma spp.) detection. The forecast maps are derived from routine testing data collected from clinics across the US and Canada and then aggregated by year and county (in the US) or forward sortation area or FSA (in Canada). There are over 61 million test results for each the three tick-borne agents and over 121,000,000 test results for the heartworm parasite. The maps also leverage several other data sources, including annual temperature, relative humidity and precipitation data collected from the PRISM database maintained by Oregon University1 (US), or the ClimateNA model2 (Canada), elevation and other ecological data derived from the National Land Cover Database3 (US) and North American Land Change Monitoring System4 (Canada), and socio-demographic data such as median household income and population density obtained from the US Census Bureau5 and the Canadian Census of Population6. The heartworm forecast also leverages data on the presence or absence of 5 Aedes, 2 Anopheles and 1 Culex mosquito species7...
Read More
Microscopic Fecal Exam Procedures
by Dr. Byron Blagburn MS, PhDFecal examination procedures likely to be accepted and implemented in most veterinary practices include centrifugal flotation, sedimentation, and direct examination (direct smear). Only flotation and sedimentation are concentration procedures. Direct smears have poor sensitivity because of the small amount of feces examined but may be useful for demonstrating motile organisms. CAPC recommends that feces be routinely screened by a centrifugal flotation method, which is consistently more sensitive than simple flotation. Accuracy of centrifugal flotation techniques depends on procedural details and specimen attributes...
Read More
Avoiding Common Pitfalls in Microscopic Fecal Examinations
by Dr. Byron Blagburn MS, PhDA “fecal” may seem like one of the more humble tasks performed in a veterinary hospital. That does not diminish the importance of this examination, which can provide valuable information on the health status of veterinary patients. Parasite diagnosis and monitoring are vital to pet health and the health of pet owners, given the zoonotic potential of many parasites...
Read More